The world’s worst countries to drive in have been ranked and mapped by the World Health Organisation. We take a look at the complete results
The latest report from the World Health Organization (WHO) indicates that road traffic deaths continue to rise around the world with an estimated 1.35 million fatalities per year.
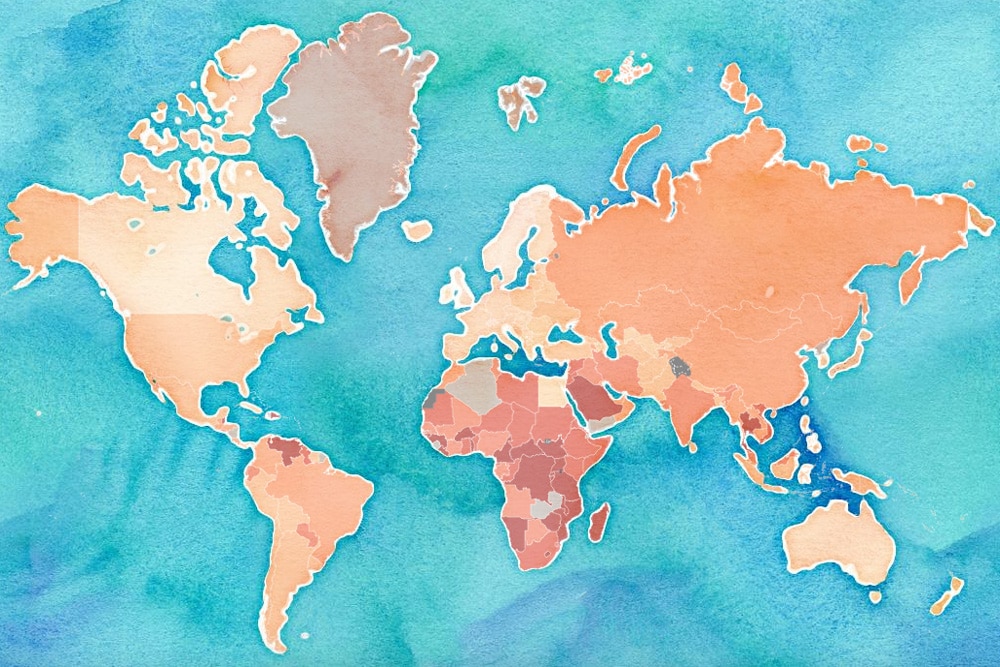
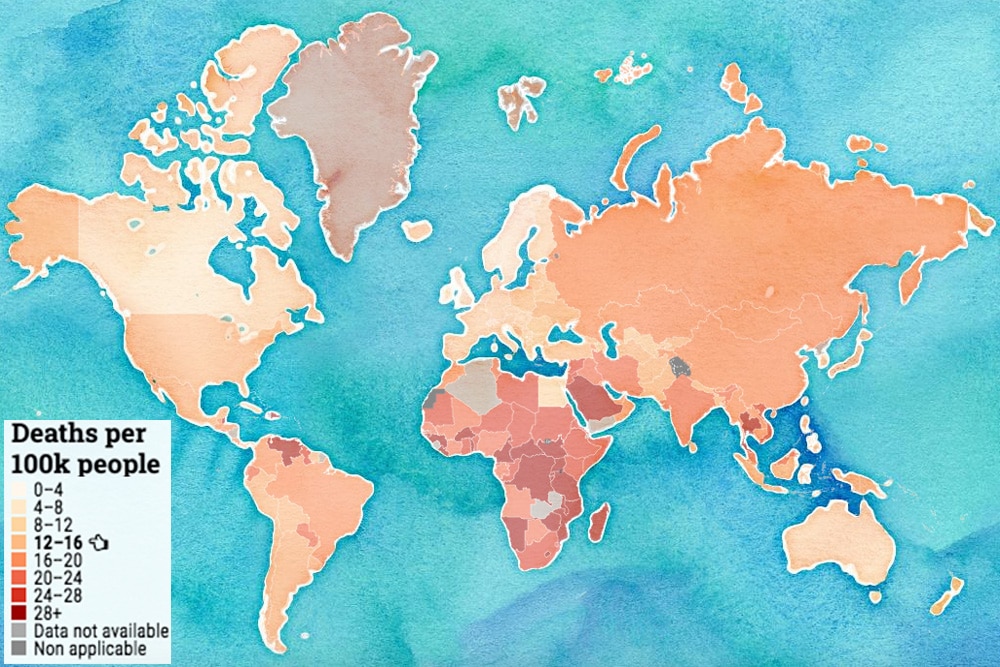
WHO releases a new Global Status Report on Road Safety every two to three years along with an interactive map that allows users to assess countries against the following criteria:
- Reported number of road traffic deaths
- Estimated number of road traffic deaths
- Estimated number of deaths per 100,000 people
- Estimated number of deaths per mode of transport (car, motorcycle, cycle, pedestrian)
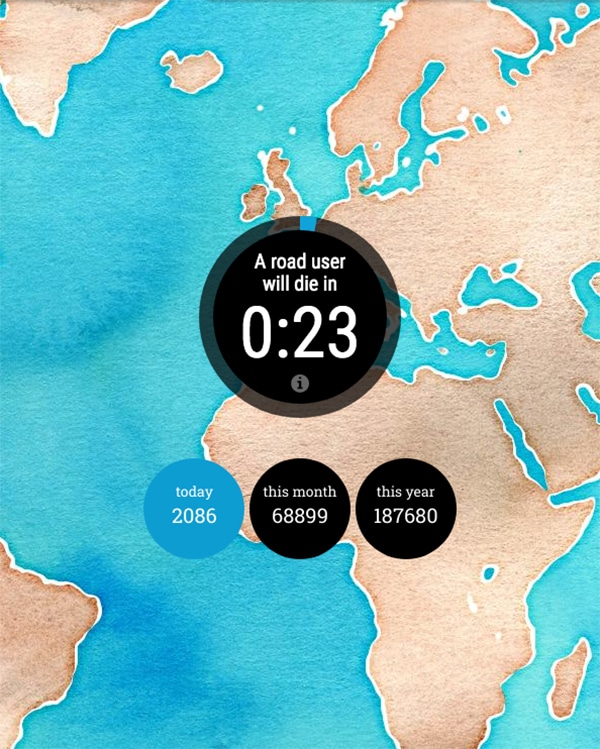
The map also includes a ‘death counter’ tracking how often a road user will die, along with the total deaths for the current day, month and year. Shockingly, it suggests a road user dies somewhere in the world every 24 seconds.
Two different figures are presented for the number of road deaths in each country: the reported number and the estimated number.
The reported number is the figure submitted to WHO by authorities in participating member states.
The estimated number is the figure WHO arrives at once adjustments are made to account for potential under-reporting, differences in definitions and any limitations a country may have when it comes to collecting data.
Member states have the opportunity to challenge WHO estimates as they are usually significantly higher than the submitted statistics.
“The number of deaths on the world’s roads remains unacceptably high, with an estimated 1.35 million people dying each year.”
World Health Organisation
World’s Best & worst roads
These 10 countries see the lowest and highest number of road traffic deaths per 100,000 people.
Best countries
- San Marino
- Maldives
- Micronesia
- Switzerland
- Norway
- Sweden
- Singapore
- UK
- Netherlands
- Denmark
Worst countries
- Liberia
- Saint Lucia
- Burundi
- Zimbabwe
- Dominican Republic
- DR of Congo
- Venezuela
- Central African Republic
- Thailand
- Guinea Bissau
Key findings
- Liberia has the world’s most dangerous roads with an estimated 35.9 deaths per 100,000 people
- India sees the highest number of road deaths with 150,785 reported (but 299,091 estimated) deaths occurring in total
- Other countries with a high number of road deaths include China, Brazil, the USA and Nigeria
- The tiny country of San Marino with a population of just over 33,000 did not report any road deaths, making it the country with the safest roads
- The highest death rates are in Africa while the lowest are in Europe
- Road traffic injuries are the 8th leading cause of death globally
- Road traffic injuries are the number one cause of death for children and young adults aged 5-29
- Over half (54%) of global deaths are of non-car users: pedestrians (23%), cyclists (3%) and motorcyclists (28%)
- Road traffic crashes cost most countries 3% of their gross domestic product (GDP)
- Further to the 1.35 million fatalities, between 20-50 million more people suffer non-fatal injuries
- 93% of the world’s road traffic deaths occur in low- and middle-income countries, even though these countries only have around 60% of the world’s vehicles
“There has been no reduction in the number of road traffic deaths in any low-income country since 2013.”
World Health Organisation
Europe’s most dangerous countries to drive in
- Russia, 18.0
- Armenia, 17.1
- Bosnia & Herzegovina, 15.7
- Georgia, 15.3
- Ukraine, 13.7
- Albania, 13.6
- Turkey, 12.3
- Montenegro, 10.7
- Romania, 10.3
- Bulgaria, 10.2
Asia’s most dangerous COUNTRIES TO DRIVE IN
- Thailand, 32.7
- Vietnam, 26.4
- Malaysia, 23.6
- India, 22.6
- Myanmar, 19.9
- China, 18.2
- Tajikistan, 18.1
- Cambodia, 17.8
- Kazakhstan, 17.6
- Bhutan, 17.4
Africa’s most dangerous COUNTRIES TO DRIVE IN
- Liberia, 35.9
- Burundi, 34.7
- Zimbabwe, 34.7
- DR Congo, 33.7
- Central African Republic, 33.6
- Guinea-Bissau, 31.1
- Malawi, 31.0
- Burkina Faso, 30.5
- Namibia, 30.4
- Cameroon, 30.1
World’s worst countries to drive in
DP 100k: estimated deaths per 100,000 people
Rep. deaths: total number of reported road traffic deaths
Est. deaths: estimated total number of road traffic deaths (WHO)
| Rank | Country | DP 100k | Rep. deaths | Est. deaths |
|---|---|---|---|---|
| 1 | Liberia | 35.9 | 175 | 1,657 |
| 2 | Saint Lucia | 35.4 | 15 | 63 |
| 3 | Burundi | 34.7 | 112 | 3,651 |
| 4 | Zimbabwe | 34.7 | 1,721 | 5,601 |
| 5 | Dominican Rep. | 34.6 | 3,118 | 3,684 |
| 6 | Dem. Rep. of Congo | 33.7 | 385 | 26,529 |
| 7 | Venezuela | 33.7 | 7,028 | 1,0640 |
| 8 | Central African Rep. | 33.6 | 193 | 1,546 |
| 9 | Thailand | 32.7 | 21,745 | 22,491 |
| 10 | Guinea-Bissau | 31.1 | 122 | 565 |
| 11 | Malawi | 31.0 | 1,122 | 5,601 |
| 12 | Burkina Faso | 30.5 | 878 | 5,686 |
| 13 | Namibia | 30.4 | 731 | 754 |
| 14 | Cameroon | 30.1 | 1,879 | 7,066 |
| 15 | Mozambique | 30.1 | 1,379 | 8,665 |
| 16 | South Sudan | 29.9 | 130 | 3,661 |
| 17 | Gambia | 29.7 | 139 | 605 |
| 18 | Rwanda | 29.7 | 593 | 3,535 |
| 19 | Togo | 29.2 | 514 | 2224 |
| 20 | Tanzania | 29.2 | 3,256 | 16,252 |
| 21 | Uganda | 29.0 | 3,503 | 12,036 |
| 22 | Lesotho | 28.9 | 318 | 638 |
| 23 | Saudi Arabia | 28.8 | 9,031 | 9,311 |
| 24 | Madagascar | 28.6 | 340 | 7,108 |
| 25 | Belize | 28.3 | 101 | 104 |
| 26 | Guinea | 28.2 | 458 | 3,490 |
| 27 | Kenya | 27.8 | 2,965 | 13,463 |
| 28 | Chad | 27.6 | 1,122 | 3,990 |
| 29 | Benin | 27.5 | 637 | 2,986 |
| 30 | Sao Tome & Principe | 27.5 | 23 | 55 |
| 31 | Congo | 27.4 | 308 | 1405 |
| 32 | Somalia | 27.1 | 165 | 3,884 |
| 33 | Eswatini | 26.9 | 203 | 361 |
| 34 | Ethiopia | 26.7 | 4,352 | 27,326 |
| 35 | Comoros | 26.5 | 23 | 211 |
| 36 | Syrian | 26.5 | 714 | 4,890 |
| 37 | Vietnam | 26.4 | 8,417 | 24,970 |
| 38 | Niger | 26.2 | 978 | 5414, |
| 39 | Libya | 26.1 | 2,414 | 1,645 |
| 40 | South Africa | 25.9 | 14,071 | 14,507 |
| 41 | Sudan | 25.7 | 2,311 | 10,178 |
| 42 | Eritrea | 25.3 | 130 | 1,255 |
| 43 | Cabo Verde | 25.0 | 41 | 135 |
| 44 | Ghana | 24.9 | 1,802 | 7,018 |
| 45 | Mauritania | 24.7 | 184 | 1,064 |
| 46 | Equatorial Guinea | 24.6 | 41 | 300 |
| 47 | Guyana | 24.6 | 128 | 190 |
| 48 | Jordan | 24.4 | 750 | 2,306 |
| 49 | Botswana | 23.8 | 450 | 535 |
| 50 | Angola | 23.6 | 2,845 | 6,797 |
| 51 | Côte d’Ivoire | 23.6 | 991 | 5,582 |
| 52 | Malaysia | 23.6 | 7,152 | 7,374 |
| 53 | Senegal | 23.4 | 604 | 3,609 |
| 54 | Gabon | 23.2 | 54 | 460 |
| 55 | Mali | 23.1 | 541 | 4,159 |
| 56 | Tunisia | 22.8 | 1443 | 2,595 |
| 57 | Paraguay | 22.7 | 1202 | 1,529 |
| 58 | India | 22.6 | 150,785 | 299,091 |
| 59 | El Salvador | 22.2 | 1215 | 1411 |
| 60 | Nigeria | 21.4 | 5,053 | 39,802 |
| 61 | Ecuador | 21.3 | 2,894 | 3,490 |
| 62 | Iraq | 20.7 | 4134, | 7,686 |
| 63 | Iran | 20.5 | 15,932 | 16,426 |
| 64 | Myanmar | 19.9 | 4887 | 10,540 |
| 65 | Brazil | 19.7 | 38,651 | 41,007 |
| 66 | Morocco | 19.6 | 3,785 | 6,917 |
| 67 | Colombia | 18.5 | 7,158 | 8,987 |
| 68 | China | 18.2 | 58,022 | 256,180 |
| 69 | Lebanon | 18.1 | 576 | 1,090 |
| 70 | Tajikistan | 18.1 | 427 | 1577 |
| 71 | UAE | 18.1 | 725 | 1678 |
| 72 | Russian Federation | 18.0 | 20,308 | 25,969 |
| 73 | Cambodia | 17.8 | 1,852 | 2,803 |
| 74 | Kazakhstan | 17.6 | 2,625 | 3,158 |
| 75 | Kuwait | 17.6 | 424 | 715 |
| 76 | Bhutan | 17.4 | 125 | 139 |
| 77 | Solomon Islands | 17.4 | 11 | 104 |
| 78 | Cook Islands | 17.3 | 5 | 3 |
| 79 | Armenia | 17.1 | 267 | 499 |
| 80 | Tonga | 16.8 | 18 | 18 |
| 81 | Costa Rica | 16.7 | 795 | 812 |
| 82 | Honduras | 16.7 | 1,407 | 1,525 |
| 83 | Guatemala | 16.6 | 2,058 | 2,758 |
| 84 | Lao | 16.6 | 1,086 | 1,120 |
| 85 | Mongolia | 16.5 | 484 | 499 |
| 86 | Oman | 16.1 | 692 | 713 |
| 87 | Nepal | 15.9 | 2,006 | 4,622 |
| 88 | Seychelles | 15.9 | 15 | 15 |
| 89 | Vanuatu | 15.9 | 9 | 43 |
| 90 | Bosnia & Herzegovina | 15.7 | 318 | 552 |
| 91 | Bolivia | 15.5 | 1,259 | 1,687 |
| 92 | Kyrgyzstan | 15.4 | 812 | 916 |
| 93 | Bangladesh | 15.3 | 2,376 | 2,4954 |
| 94 | Georgia | 15.3 | 581 | 599 |
| 95 | Afghanistan | 15.1 | 1,565 | 5,230 |
| 96 | Sri Lanka | 14.9 | 3,003 | 3,096 |
| 97 | Suriname | 14.5 | 74 | 81 |
| 98 | Turkmenistan | 14.5 | 543 | 823 |
| 99 | Pakistan | 14.3 | 4,448 | 27,582 |
| 100 | Panama | 14.3 | 440 | 575 |
| 101 | Papua New Guinea | 14.2 | 158 | 1,145 |
| 102 | Argentina | 14.0 | 5,530 | 6,119 |
| 103 | Mauritius | 13.7 | 144 | 173 |
| 104 | Ukraine | 13.7 | 4,687 | 6,089 |
| 105 | Albania | 13.6 | 269 | 399 |
| 106 | Jamaica | 13.6 | 379 | 391 |
| 107 | Peru | 13.5 | 2,696 | 4,286 |
| 108 | Uruguay | 13.4 | 446 | 460 |
| 109 | Mexico | 13.1 | 16,039 | 16,725 |
| 110 | Timor-Leste | 12.7 | 71 | 161 |
| 111 | Chile | 12.5 | 1,675 | 2,245 |
| 112 | USA | 12.4 | 35,092 | 39,888 |
| 113 | Philippines | 12.3 | 10,012 | 12,690 |
| 114 | Turkey | 12.3 | 7,300 | 9,782 |
| 115 | Indonesia | 12.2 | 31,282 | 31,726 |
| 116 | Trinidad & Tobago | 12.1 | 135 | 165 |
| 117 | Uzbekistan | 11.5 | 2,496 | 3,617 |
| 118 | Samoa | 11.3 | 17 | 22 |
| 119 | Dominica | 10.9 | 10 | 8 |
| 120 | Montenegro | 10.7 | 65 | 67 |
| 121 | Romania | 10.3 | 1,913 | 2,044 |
| 122 | Bulgaria | 10.2 | 708 | 730 |
| 123 | South Korea | 9.8 | 4,292 | 4,990 |
| 124 | Egypt | 9.7 | 8,211 | 9,287 |
| 125 | Poland | 9.7 | 3,026 | 3,698 |
| 126 | Rep. of Moldova | 9.7 | 346 | 394 |
| 127 | Fiji | 9.6 | 60 | 86 |
| 128 | Grenada | 9.3 | 10 | 10 |
| 129 | Latvia | 9.3 | 158 | 184 |
| 130 | Qatar | 9.3 | 178 | 239 |
| 131 | Greece | 9.2 | 824 | 1,026 |
| 132 | Belarus | 8.9 | 588 | 841 |
| 133 | Azerbaijan | 8.7 | 759 | 845 |
| 134 | Cuba | 8.5 | 750 | 975 |
| 135 | Croatia | 8.1 | 307 | 340 |
| 136 | Lithuania | 8.0 | 192 | 234 |
| 137 | Antigua & Barbuda | 7.9 | 8 | 8 |
| 138 | Hungary | 7.8 | 607 | 756 |
| 139 | New Zealand | 7.8 | 327 | 364 |
| 140 | Portugal | 7.4 | 563 | 768 |
| 141 | Serbia | 7.4 | 607 | 649 |
| 142 | Iceland | 6.6 | 18 | 22 |
| 143 | Slovenia | 6.4 | 130 | 134 |
| 144 | North Macedonia | 6.4 | 148 | 134 |
| 145 | Luxembourg | 6.3 | 32 | 36 |
| 146 | Estonia | 6.1 | 71 | 80 |
| 147 | Malta | 6.1 | 22 | 26 |
| 148 | Slovakia | 6.1 | 275 | 330 |
| 149 | Czechia | 5.9 | 611 | 630 |
| 150 | Belgium | 5.8 | 637 | 657 |
| 151 | Canada | 5.8 | 1,858 | 2,118 |
| 152 | Australia | 5.6 | 1,296 | 1,351 |
| 153 | Barbados | 5.6 | 9 | 16 |
| 154 | Italy | 5.6 | 3,428 | 3,333 |
| 155 | France | 5.5 | 3,477 | 3,585 |
| 156 | West Bank & Gaza Strip | 5.3 | 159 | 252 |
| 157 | Austria | 5.2 | 432 | 452 |
| 158 | Cyprus | 5.1 | 46 | 60 |
| 159 | Finland | 4.7 | 252 | 260 |
| 160 | Kiribati | 4.4 | 5 | 5 |
| 161 | Israel | 4.2 | 335 | 345 |
| 162 | Germany | 4.1 | 3,206 | 3,327 |
| 163 | Ireland | 4.1 | 188 | 194 |
| 164 | Japan | 4.1 | 4,682 | 5,224 |
| 165 | Spain | 4.1 | 1,810 | 1,922 |
| 166 | Denmark | 4.0 | 211 | 227 |
| 167 | Netherlands | 3.8 | 621 | 648 |
| 168 | UK | 3.1 | 1,804 | 2,019 |
| 169 | Singapore | 2.8 | 141 | 155 |
| 170 | Sweden | 2.8 | 270 | 278 |
| 171 | Norway | 2.7 | 135 | 143 |
| 172 | Switzerland | 2.7 | 216 | 223 |
| 173 | Micronesia | 1.9 | 2 | 2 |
| 174 | Maldives | 0.9 | 4 | 4 |
| 175 | San Marino | 0 | 0 | 0 |
The complete Global Status Report on Road Safety can be downloaded here.
More rankings and articles can be found in our remote work area:
► Most dangerous countries in the world
► Countries with the best healthcare in the world
► Most peaceful countries in the world
► Best countries for women
► Poorest countries in the world – ranked
► Happiest countries in the world
► World’s most powerful passport
► Countries with the fastest internet in the world
► Most stressed countries in the world
► Most expensive cities for expats
► World’s most democratic countries
Enjoyed this post? pin it for later…