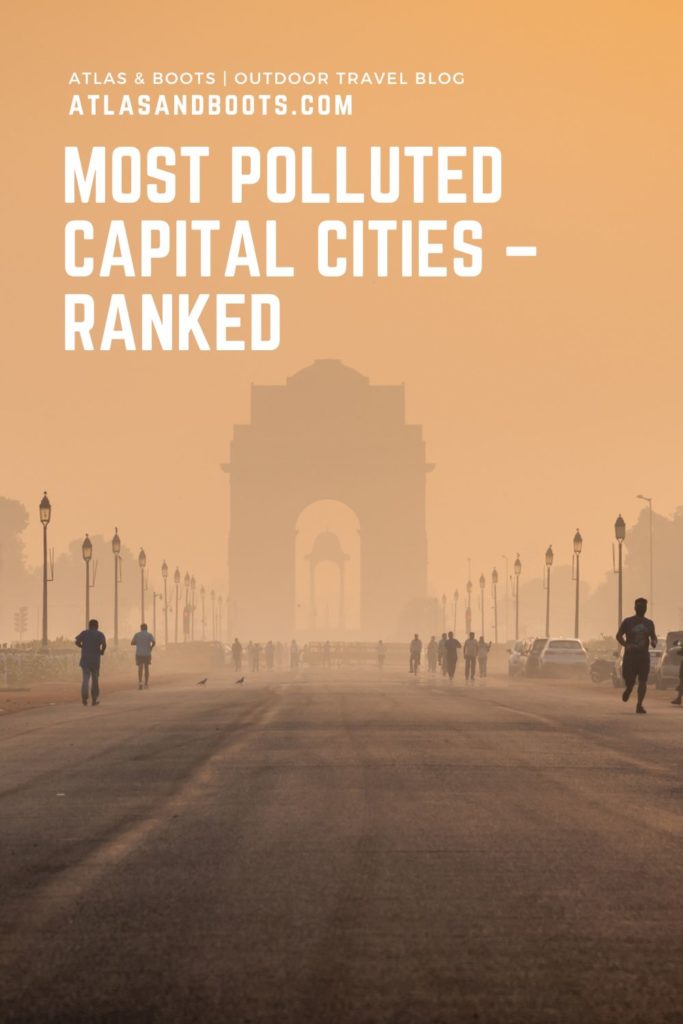
The world’s most polluted capital cities have been ranked, revealing alarming levels of harmful particles in our urban areas
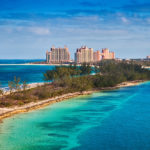
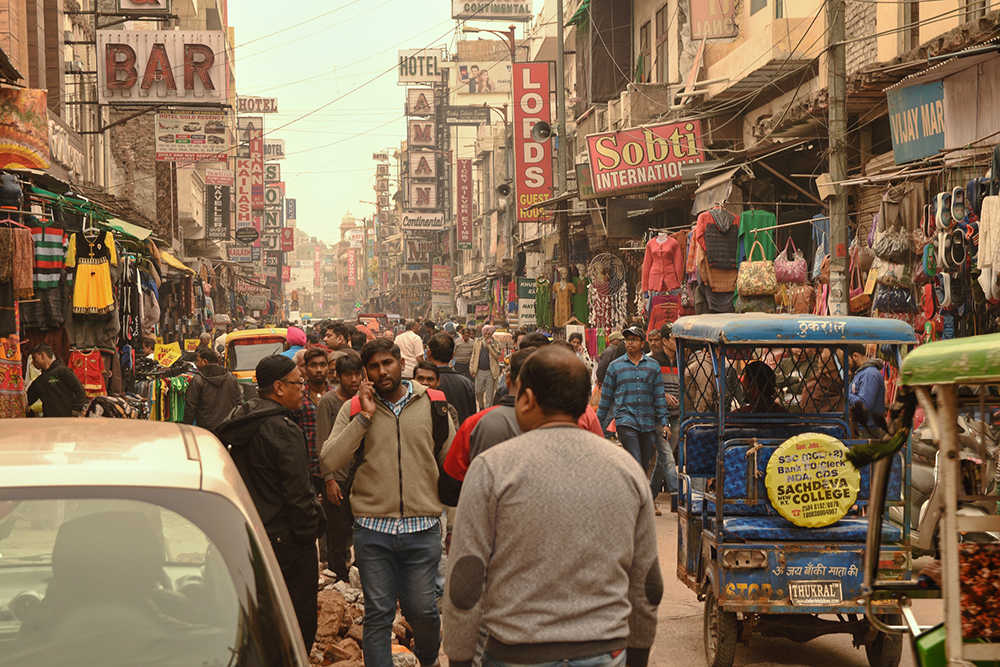
Delhi in India is the most polluted capital city in the world, according to the latest World Air Quality Report from IQAir, a Swiss air‐quality technology company.
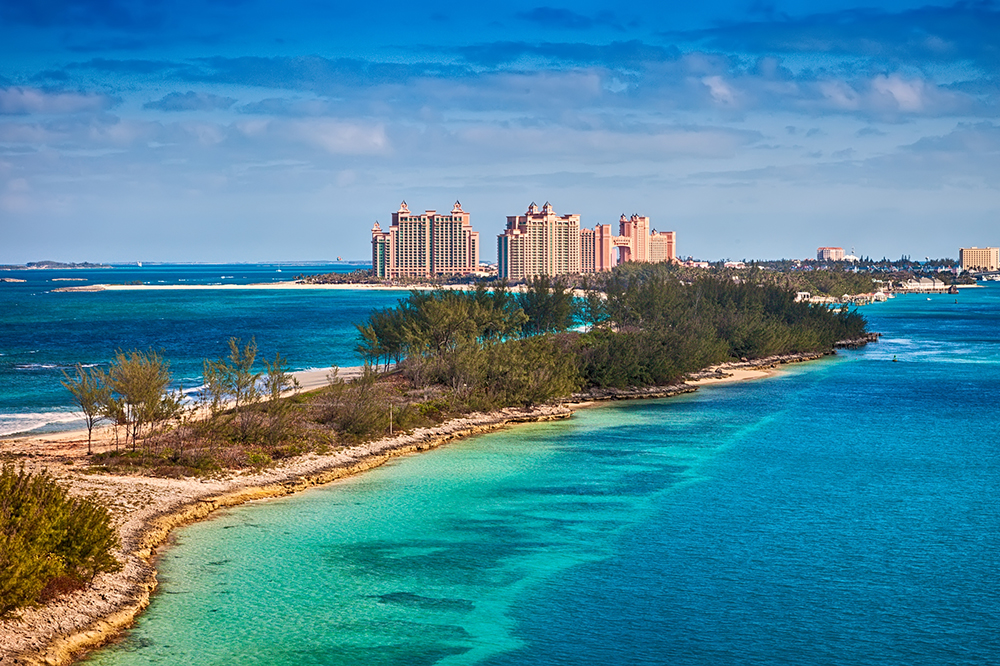
At the other end of the scale, Nassau in the Bahamas is the world’s least polluted capital city. The Bahamas is also the country with the cleanest air in the world overall.
The annual global assessment uses empirically measured ground‐level PM2.5 data – from over 40,000 monitoring stations across 8,954 locations in 138 countries, territories, and regions – to analyse annual air quality exposure at city, country and regional levels.
The report includes extensive city and national rankings, regional summaries and a global map. It paints a sobering picture: air pollution remains a global challenge, with only a handful of countries meeting WHO guidelines.
Yet incremental progress is occurring – cities adhering to thresholds have nearly doubled year-over-year. By combining robust measurement practices with broad geographic data, the report provides a vital resource in the fight for cleaner air.
10 most polluted capital cities
IQAir estimates that 99% of the global population lives in areas not meeting WHO air quality recommendations. Air pollution is the second-leading global risk factor for premature death, especially among children.
- Delhi, India
- N’Djamena, Chad
- Dhaka, Bangladesh
- Kinshasa, DR Congo
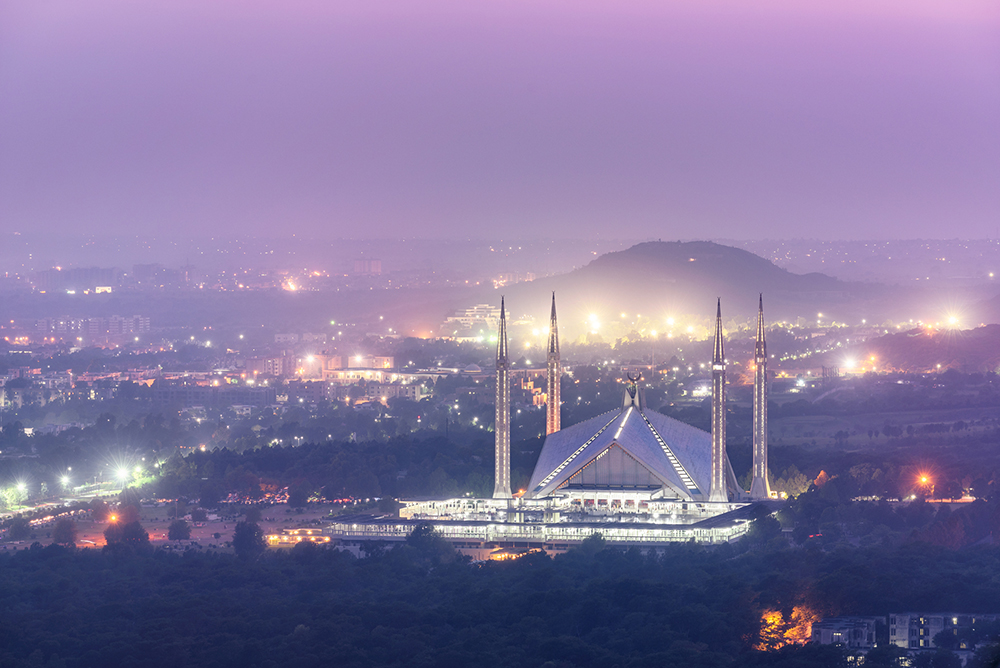
- Islamabad, Pakistan
- Dushanbe, Tajikistan
- Hanoi, Vietnam
- Kathmandu, Nepal
- Abuja, Nigeria
- Jakarta, Indonesia
8 least polluted capital cities
Only 17% of global cities and just eight capital cities meet the WHO’s air pollution guidelines.
- Nassau, Bahamas
- San Juan, Puerto Rico
- Papeete, French Polynesia
- Bridgetown, Barbados
- Reykjavik, Iceland
- Canberra, Australia
- Wellington, New Zealand
- Tallinn, Estonia
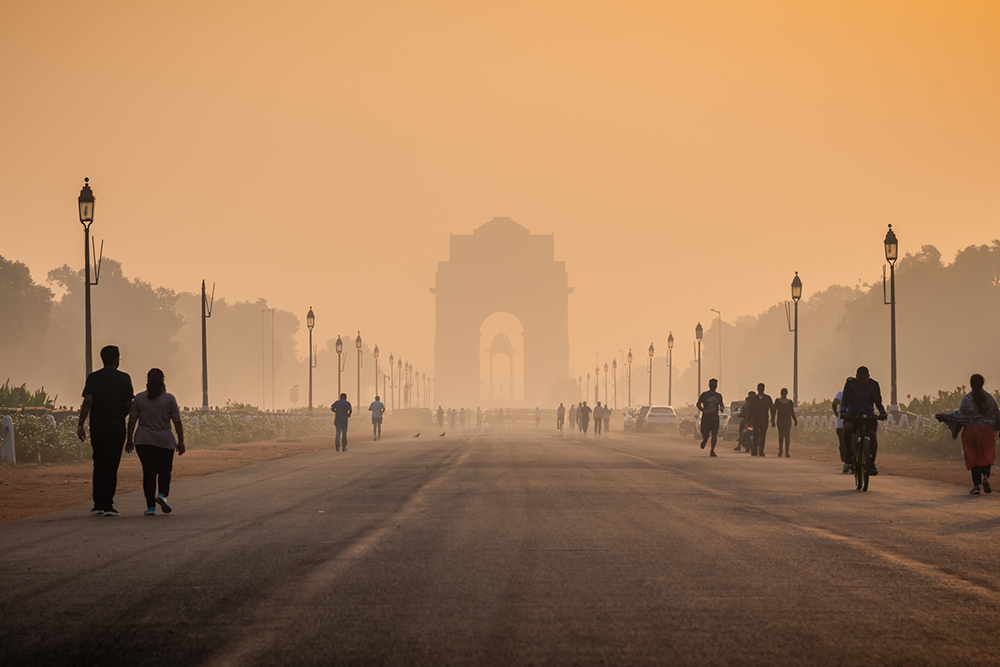
Air Quality Index
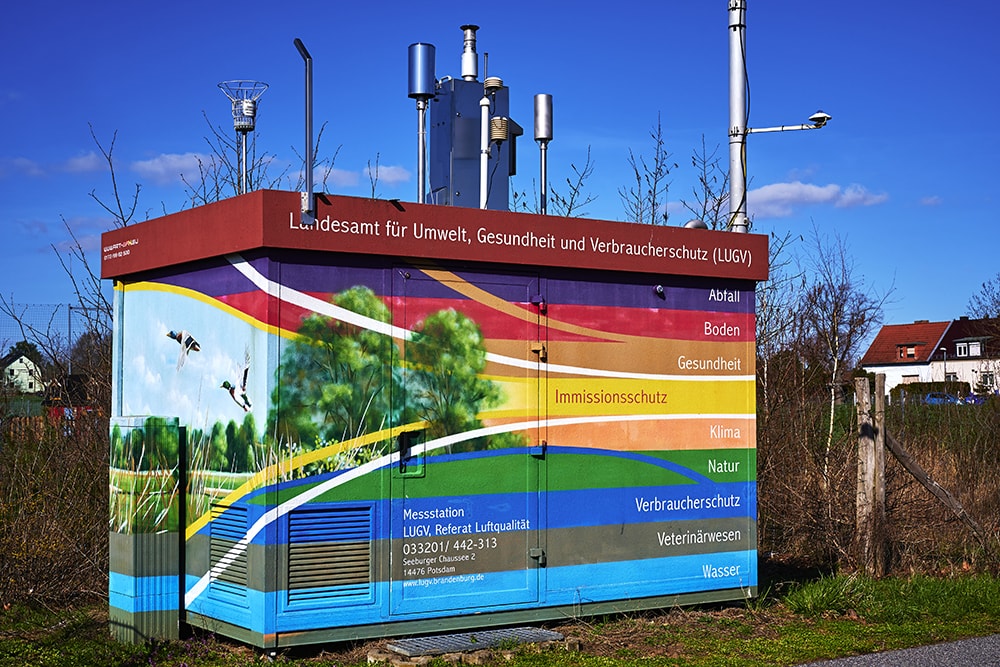
The report analyses results from over 40,000 monitoring stations around the world, making it the world’s largest centralised platform for measuring air quality.
It also draws on data collected from thousands of clean air initiatives administered by governments, non-profit organisations, citizens, communities and private companies.
The report focuses on PM2.5 concentrations (μg/m³) as this pollutant is widely regarded as most harmful to human health. PM2.5 is defined as ambient airborne particles measuring up to 2.5 microns in size. A micron (or micrometre) is one-millionth of a metre or one-thousandth of a millimetre.
Its microscopic size allows the particles to enter the bloodstream via the respiratory system and travel through the body, causing a range of health problems, including asthma, lung cancer and heart disease.
Air pollution is also associated with low birth weight, increased acute respiratory infections and stroke.
The WHO’s Air Quality Guideline value for PM2.5 exposure, which has been proven to be free of health impacts, is 10µg/m³ or 10 micrograms of air pollutant per cubic meter of air.
Most polluted capital cities – complete ranking
The World Air Quality Report ranks 121 national capital cities from the most polluted to the least.
| Rank | City | PM2.5 concentration |
|---|---|---|
| 1 | Delhi, India | 91.8 |
| 2 | N’Djamena, Chad | 91.6 |
| 3 | Dhaka, Bangladesh | 78.0 |
| 4 | Kinshasa, DR Congo | 58.2 |
| 5 | Islamabad, Pakistan | 52.4 |
| 6 | Dushanbe, Tajikistan | 46.3 |
| 7 | Hanoi, Vietnam | 45.4 |
| 8 | Kathmandu, Nepal | 45.1 |
| 9 | Abuja, Nigeria | 42.2 |
| 10 | Jakarta, Indonesia | 41.7 |
| 11 | Kampala, Uganda | 41.0 |
| 12 | Kigali, Rwanda | 40.8 |
| 13 | Baghdad, Iraq | 40.5 |
| 14 | Cairo, Egypt | 39.9 |
| 15 | Yaounde, Cameroon | 36.3 |
| 16 | Accra, Ghana | 36.3 |
| 17 | Abu Dhabi, UAE | 32.0 |
| 18 | Manama, Bahrain | 31.8 |
| 19 | Tashkent, Uzbekistan | 31.4 |
| 20 | Doha, Qatar | 31.3 |
| Rank | City | PM2.5 concentration |
|---|---|---|
| 21 | Beijing, China | 30.9 |
| 22 | Sarajevo, Bosnia Herz. | 30.8 |
| 23 | Kuwait City, Kuwait | 30.2 |
| 24 | Vientiane, Laos | 27.5 |
| 25 | Ashgabat, Turkmenistan | 26.5 |
| 26 | Lome, Togo | 26.0 |
| 27 | Ulaanbaatar, Mongolia | 25.7 |
| 28 | Harare, Zimbabwe | 24.8 |
| 29 | Yerevan, Armenia | 24.4 |
| 30 | Riyadh, Saudi Arabia | 23.7 |
| 31 | Dakar, Senegal | 22.3 |
| 32 | Addis Ababa, Ethiopia | 22.2 |
| 33 | Phnom Penh, Cambodia | 21.9 |
| 34 | Skopje, North Macedonia | 21.6 |
| 35 | Lusaka, Zambia | 21.4 |
| 36 | Bishkek, Kyrgyzstan | 21.2 |
| 37 | Antananarivo, Madagascar | 20.5 |
| 38 | Tripoli, Libya | 19.9 |
| 39 | Pretoria, South Africa | 19.6 |
| 40 | Mexico City, Mexico | 19.5 |
| Rank | City | PM2.5 concentration |
|---|---|---|
| 41 | Guatemala City, Guatemala | 18.9 |
| 42 | Bangkok, Thailand | 18.9 |
| 43 | Baku, Azerbaijan | 18.3 |
| 44 | Lima, Peru | 18.2 |
| 45 | Belgrade, Serbia | 17.9 |
| 46 | Macao, Macao SAR | 17.7 |
| 47 | Kuala Lumpur, Malaysia | 17.7 |
| 48 | Georgetown, Guyana | 17.5 |
| 49 | Seoul, South Korea | 17.5 |
| 50 | Manila, Philippines | 17.4 |
| 51 | Santiago, Chile | 17.3 |
| 52 | San Salvador, El Salvador | 17.3 |
| 53 | Colombo, Sri Lanka | 16.9 |
| 54 | Djibouti, Djibouti | 16.8 |
| 55 | Podgorica, Montenegro | 16.8 |
| 56 | Hong Kong, Hong Kong SAR | 16.4 |
| 57 | Asuncion, Paraguay | 15.9 |
| 58 | Bucharest, Romania | 15.7 |
| 59 | Ljubljana, Slovenia | 15.6 |
| 60 | Algiers, Algeria | 15.4 |
| Rank | City | PM2.5 concentration |
|---|---|---|
| 61 | Astana, Kazakhstan | 15.4 |
| 62 | Nicosia, Cyprus | 15.2 |
| 63 | Libreville, Gabon | 15.2 |
| 64 | Tegucigalpa, Honduras | 15.2 |
| 65 | Tbilisi, Georgia | 15.1 |
| 66 | Jerusalem, Israel | 15.0 |
| 67 | Chișinău, Moldova | 14.7 |
| 68 | Tirana, Albania | 14.5 |
| 69 | Nairobi, Kenya | 14.4 |
| 70 | Pristina, Kosovo | 14.2 |
| 71 | Zagreb, Croatia | 14.1 |
| 72 | Warsaw, Poland | 13.4 |
| 73 | Bogota, Colombia | 12.7 |
| 74 | Paramaribo, Suriname | 12.5 |
| 75 | Male, Maldives | 12.2 |
| 76 | Budapest, Hungary | 12.0 |
| 77 | Bratislava, Slovakia | 12.0 |
| 78 | Montevideo, Uruguay | 11.5 |
| 79 | Prague, Czech Rep | 11.4 |
| 80 | Singapore, Singapore | 11.4 |
| Rank | City | PM2.5 concentration |
|---|---|---|
| 81 | Sofia, Bulgaria | 11.2 |
| 82 | Sucre, Bolivia | 11.1 |
| 83 | Athens, Greece | 11.0 |
| 84 | Berlin, Germany | 10.8 |
| 85 | Rome, Italy | 10.1 |
| 86 | Moscow, Russia | 10.0 |
| 87 | Vienna, Austria | 9.7 |
| 88 | Quito, Ecuador | 9.7 |
| 89 | Kyiv, Ukraine | 9.4 |
| 90 | Amsterdam, Netherlands | 9.3 |
| 91 | Riga, Latvia | 9.2 |
| 92 | Vilnius, Lithuania | 9.1 |
| 93 | Tokyo, Japan | 9.0 |
| 94 | Ankara, Turkey | 9.0 |
| 95 | Buenos Aires, Argentina | 8.9 |
| 96 | Brussels, Belgium | 8.9 |
| 97 | George Town, Cayman Islands | 8.5 |
| 98 | Paris, France | 8.3 |
| 99 | Madrid, Spain | 8.1 |
| 100 | London, UK | 7.8 |
| Rank | City | PM2.5 concentration |
|---|---|---|
| 101 | Luxembourg, Luxembourg | 7.7 |
| 102 | Washington DC, USA | 7.6 |
| 103 | Lisbon, Portugal | 7.4 |
| 104 | Bern, Switzerland | 7.2 |
| 105 | Copenhagen, Denmark | 7.1 |
| 106 | Oslo, Norway | 6.9 |
| 107 | Dublin, Ireland | 6.6 |
| 108 | Vaduz, Liechtenstein | 6.5 |
| 109 | Ottawa, Canada | 6.0 |
| 110 | Port of Spain, Trinidad & Tobago | 6.0 |
| 111 | Helsinki, Finland | 5.5 |
| 112 | Stockholm, Sweden | 5.3 |
| 113 | Brasilia, Brazil | 5.2 |
| 114 | Tallinn, Estonia | 4.3 |
| 115 | Wellington, New Zealand | 4.3 |
| 116 | Canberra, Australia | 3.9 |
| 117 | Reykjavik, Iceland | 3.8 |
| 118 | Bridgetown, Barbados | 3.1 |
| 119 | Papeete, French Polynesia | 2.8 |
| 120 | San Juan, Puerto Rico | 2.6 |
| 121 | Nassau, Bahamas | 2.3 |
Enjoyed this post? pin it for later…