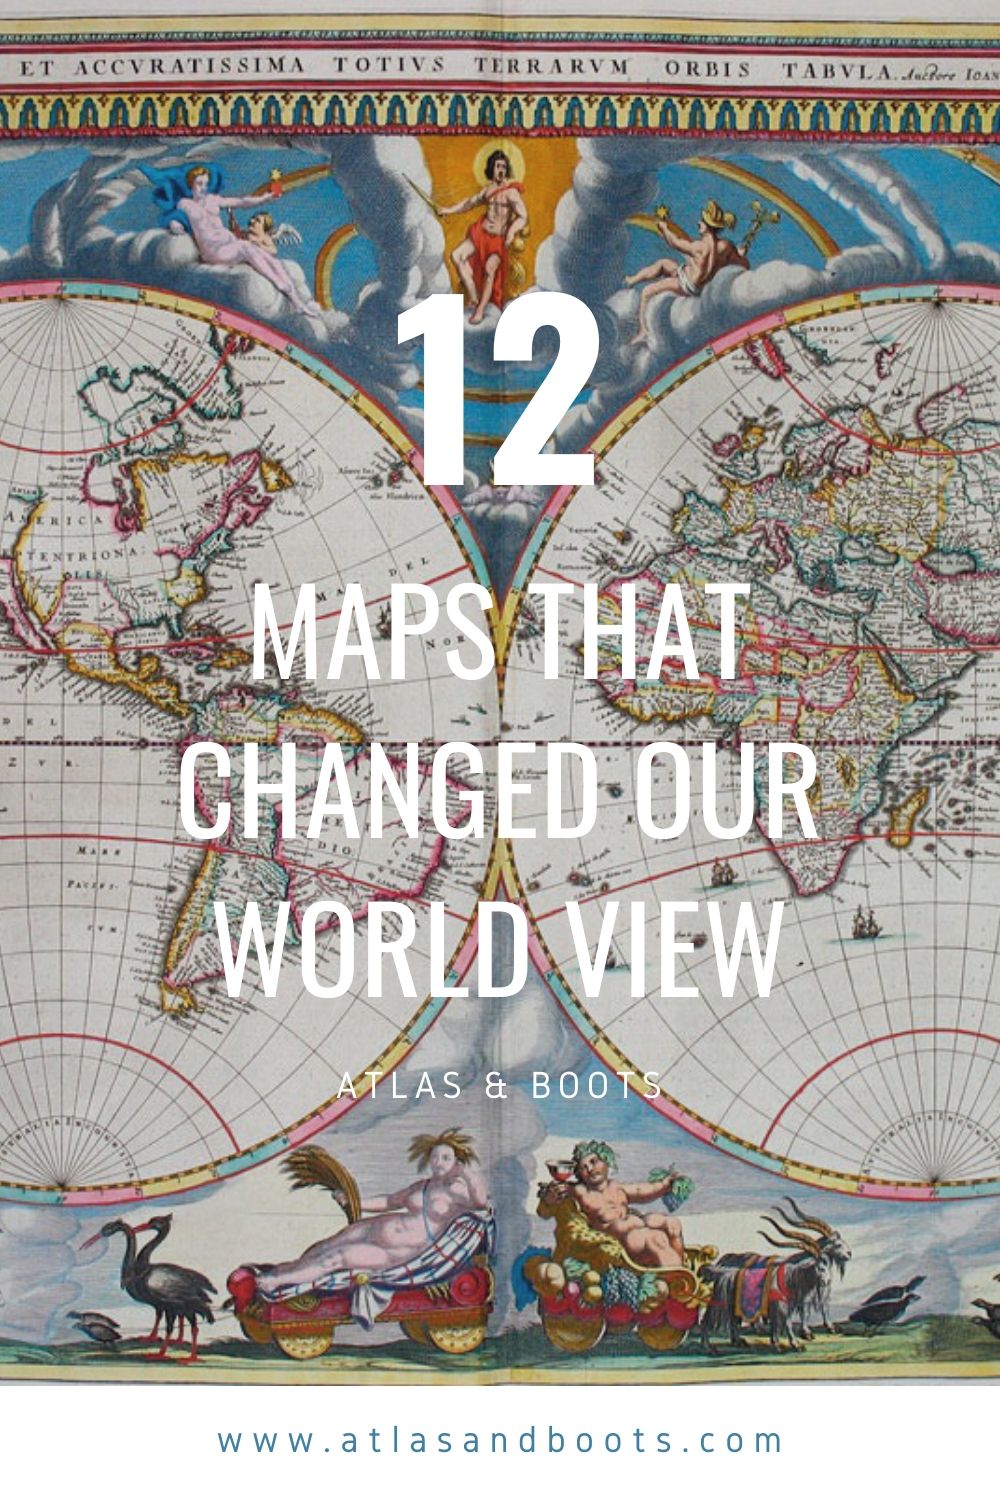
From ancient Greece to Silicon Valley, we look at the maps that changed our worldview
There are few things that evoke the romanticism of adventure quite like a map – especially old maps. Full of exotic names (Persia, Abyssinia, Rhodesia!) and olde worlde lettering, they are reminiscent of a time when men and women sacrificed their lives for adventure and exploration.
Maps ignite hopes and inspire dreams. They encourage one to sail away from the safe harbour and, in the words of Mark Twain, to explore, to dream, to discover.
Maps that changed our worldview
In ode of this great instrument of adventure, we run through 12 maps that changed our world view starting where else but Greece?
1. Anaximander world map, 6th Century BC
First up on our list of maps that changed our worldview is the Anaximander world map.
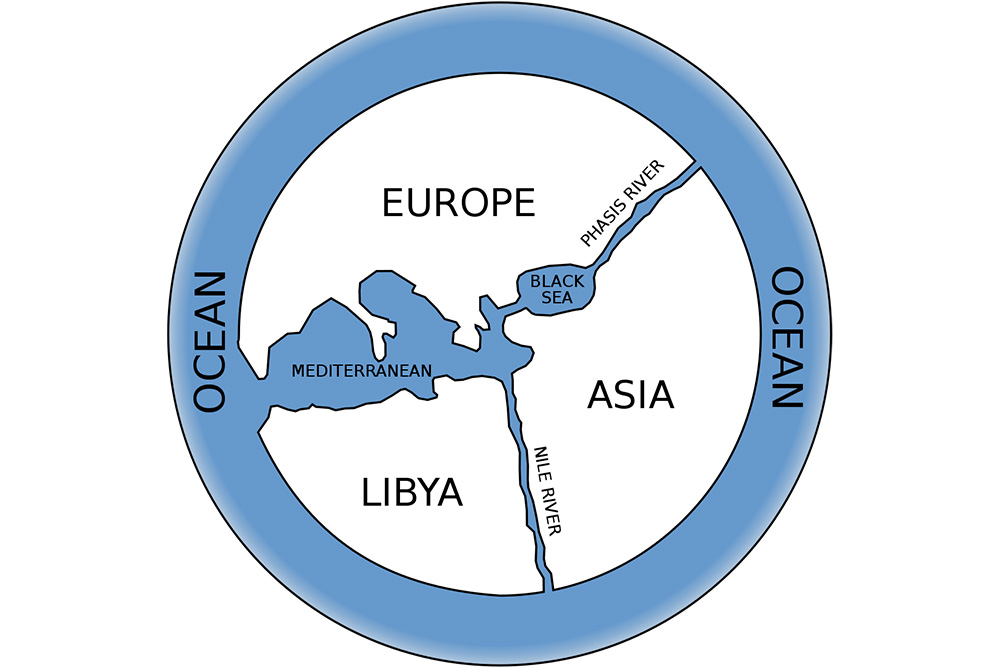
Anaximander was a Greek philosopher who lived in the 6th Century BC and was arguably the founder of cartography. His map was probably the first in the “known” world.
Anaximander’s world was very different to ours: it included only the Mediterranean Sea and three major landmasses: Europe, Asia and Libya, which represents modern-day North Africa. Most importantly, it gave future cartographers something to build on and encouraged trade, exploration and unification.
2. Eratosthenes’ map of the known world, 194 BC
Fast-forward 300 years and the “Father of Geography” was born. Eratosthenes (another Greek) developed Anaximander’s map and other pioneers’ work, advancing the map of the known world.
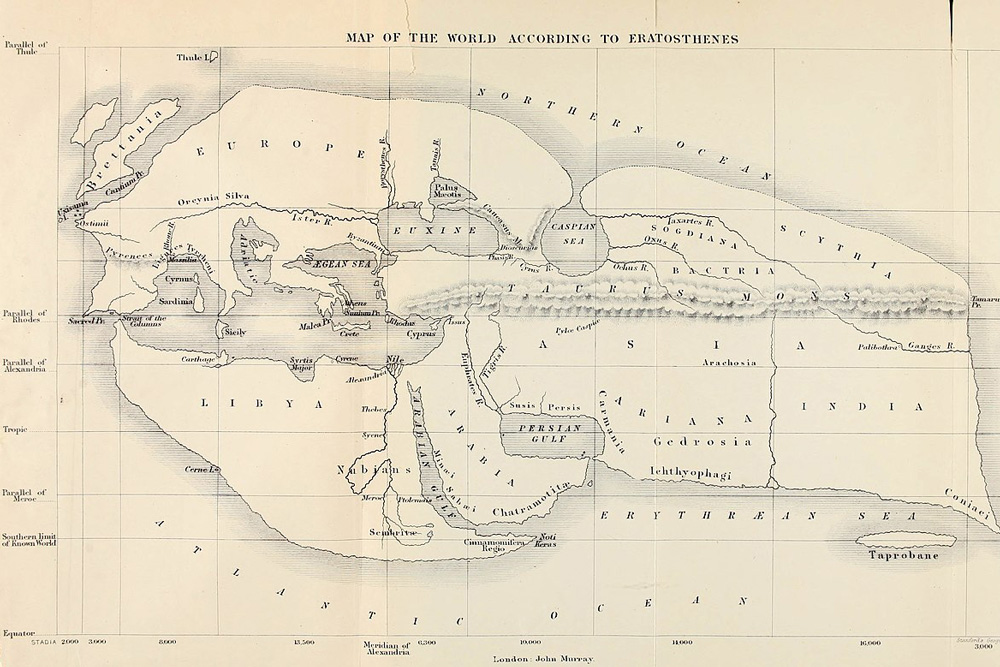
Eratosthenes inserted grid lines of longitude and latitude and suggested the existence of poles and equators on his maps. Four hundred cities and their locations were shown in his great work Geographika. Geography was born.
3. Ptolemy’s world map, Circa 150
The (*deep breath*) mathematician, astronomer, geographer and astrologer Claudius Ptolemy lived through the late first and early second century, yet his maps were still being used nearly 1,500 years later.
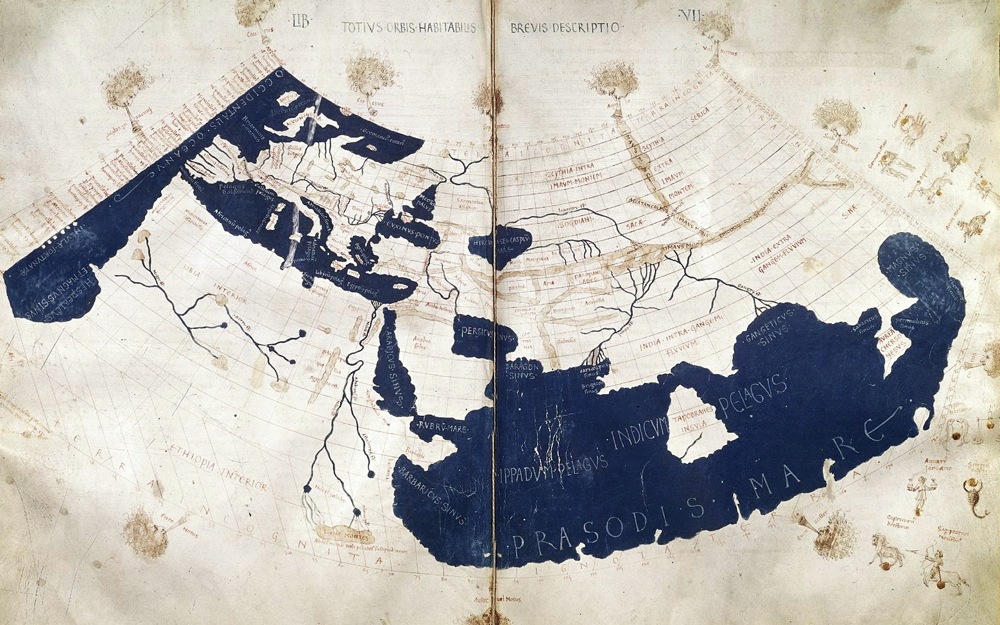
Ptolemy recognised that he only knew a small portion of the world despite including far wider areas of land from China in the east to the mid-Atlantic Ocean in the West. Most of Europe was mapped along with larger areas of Africa.
4. Fra Mauro map of the world, Circa 1450
This guy’s an Italian monk and a bit of a hippie. His map is considered “the greatest memorial of medieval cartography” which is pretty special considering he drew it upside down. Far out, man.
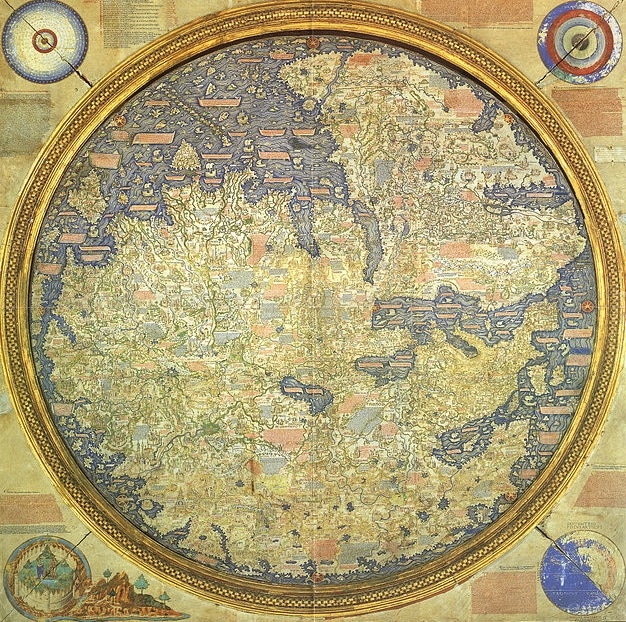
Despite the inversion, the map is exceptionally accurate compared with its predecessors. It includes detailed representations of largely unmapped areas of India, Africa, China and Japan.
He was also one of the first to suggest that the Indian Ocean was not closed and Africa could be circumnavigated by her southern end. Or would that be northern…
5. Mercator’s world map, 1569
Next up in our list of maps that changed our worldview is a map that is responsible for some of the greatest misunderstandings in cartography.
This is why Greenland looks the size of Africa on Google Maps. Gerardus Mercator’s 1569 world map is both a work of genius and controversy.
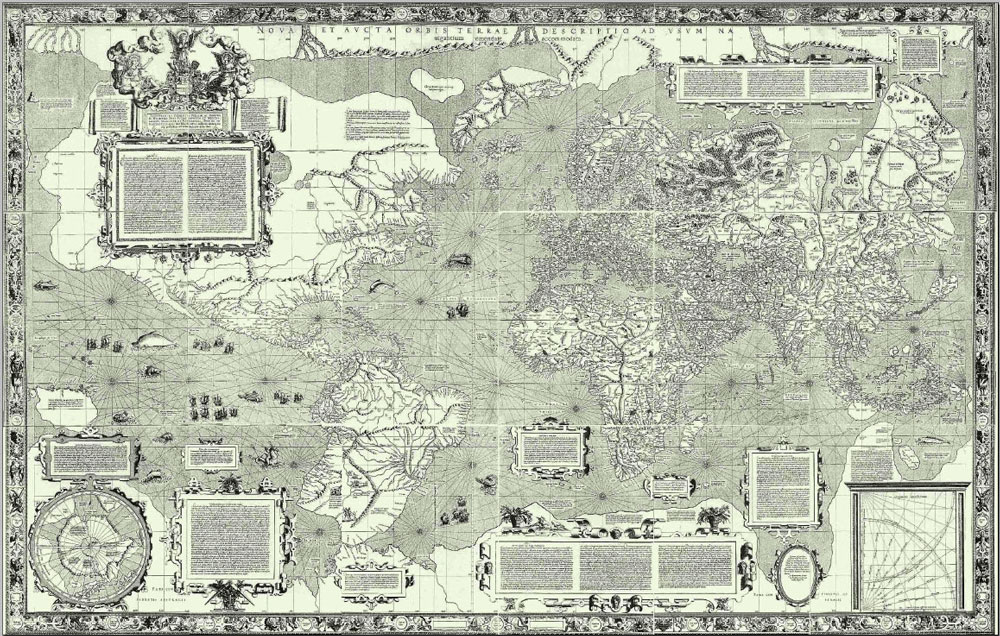
Mercator’s map was designed for ease of navigation and to quote the man himself “to spread on a plane the surface of the sphere in such a way that the positions of places shall correspond on all sides with each other, both in so far as true direction and distance are concerned and as correct longitudes and latitudes.”
The mathematics behind Mercator Projection are sound and thus it is the most popular map projection still used and so seen today.
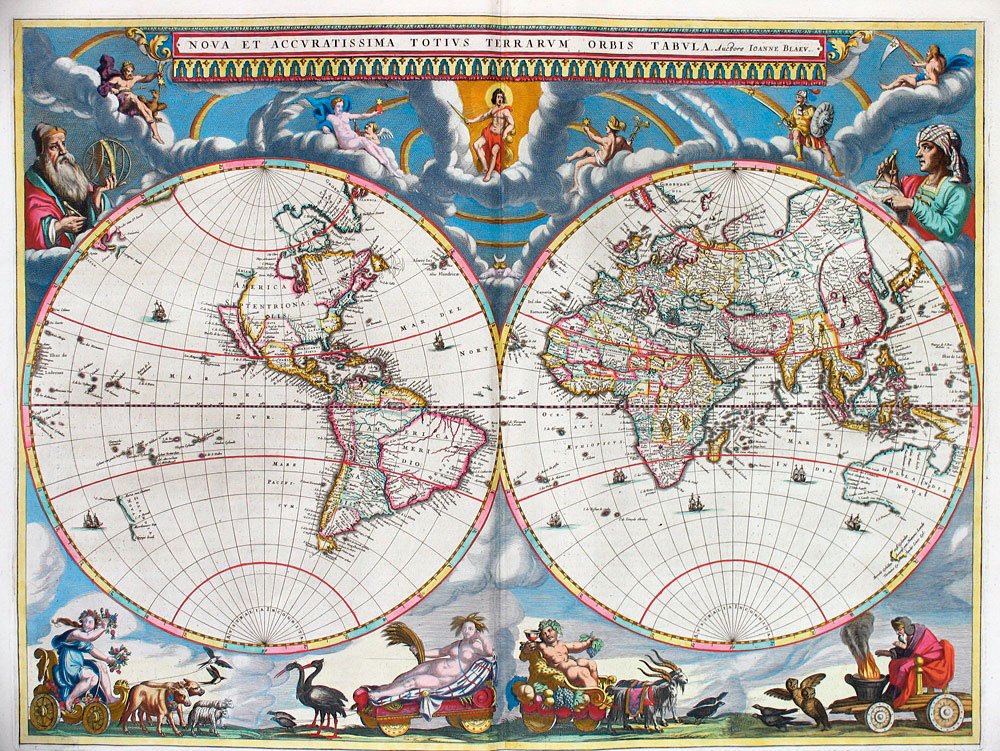
6. Atlas Maior, 1634
The atlas was born in Amsterdam and coffee tables have never looked the same since. Atlas Maior was the final version of Joan Blaeu’s world atlas.

It contained 594 maps and around 3,000 pages of text. It was the largest and most expensive book published in the 17th Century. I’m guessing your atlas is also the largest and most expensive book on your bookshelf too?
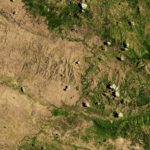
7. Life and Labour of the People in London, 1889
It’s good to know where the poor live. That’s what Charles Booth thought anyway. He was a London-based businessman who believed that estimates of poverty in London were over-inflated.
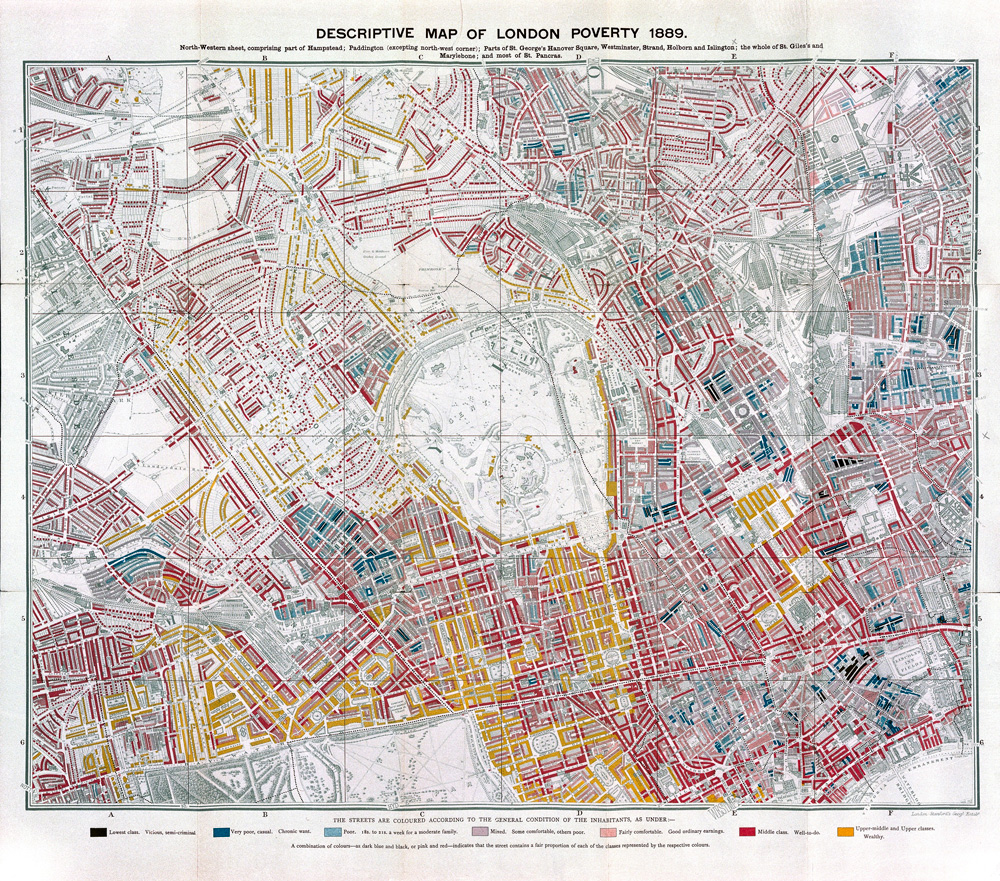
He set out to prove them wrong by creating this map and instead, proved just the opposite: that as many as one-third of Londoners lived in poverty.
The idea of plotting health and inequality across a map would prove invaluable in understanding social welfare and thus addressing it accordingly.
8. Broad Street cholera map, 1854
When cholera broke out in London in 1854, physician John Snow fought against the popular opinion that it was caused by “bad air”. He thought otherwise, and so started plotting dots representing known cases of cholera on a map of London.
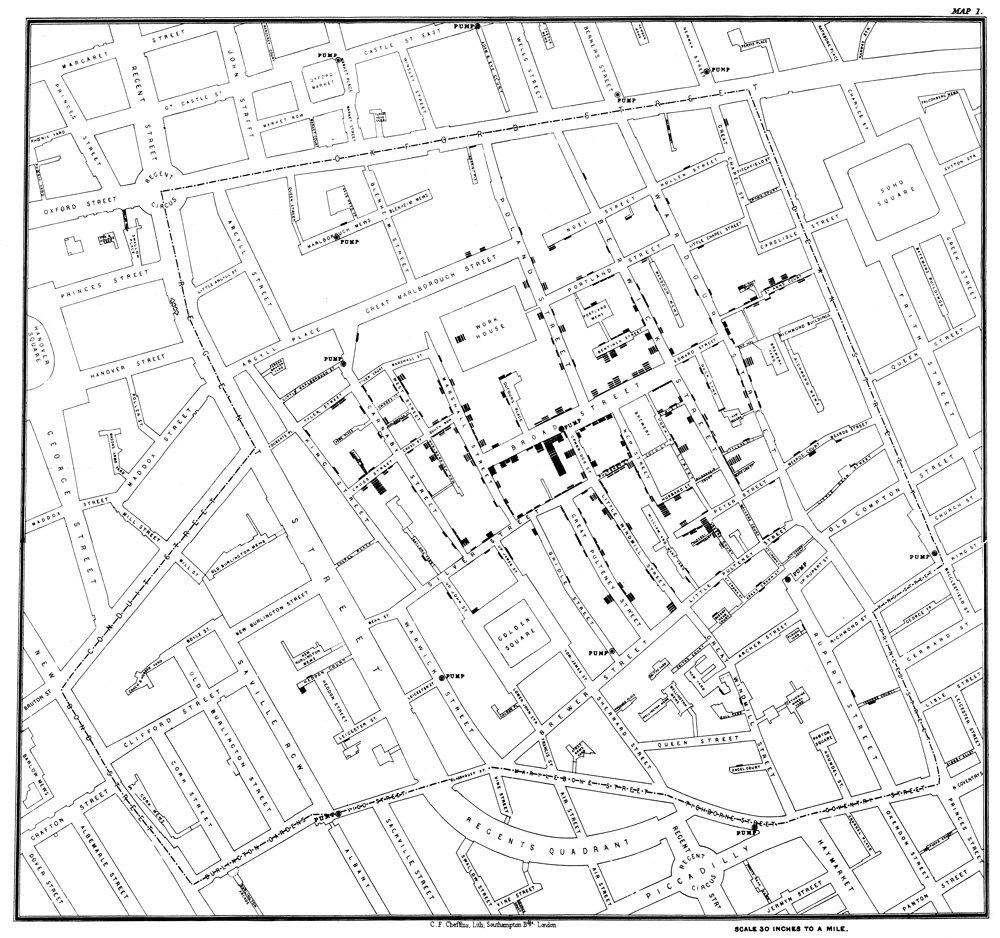
His method proved that it wasn’t bad air at all, but bad water from a street pump. The connection might sound trivial, but in reality, Snow is responsible for saving millions of lives. His work was a major event in the history of public health and is regarded as the founding event of the science of epidemiology.
9. Ordnance Survey (OS) maps, 1791 – present day
Thanks to these handy maps, whenever I go trekking across Dartmoor I know exactly where the nearest pub is. There’s a little blue beer mug marked on the map ensuring that every evening I can settle down in a comfy chair next to a warm fire and drink myself into my sleeping bag.
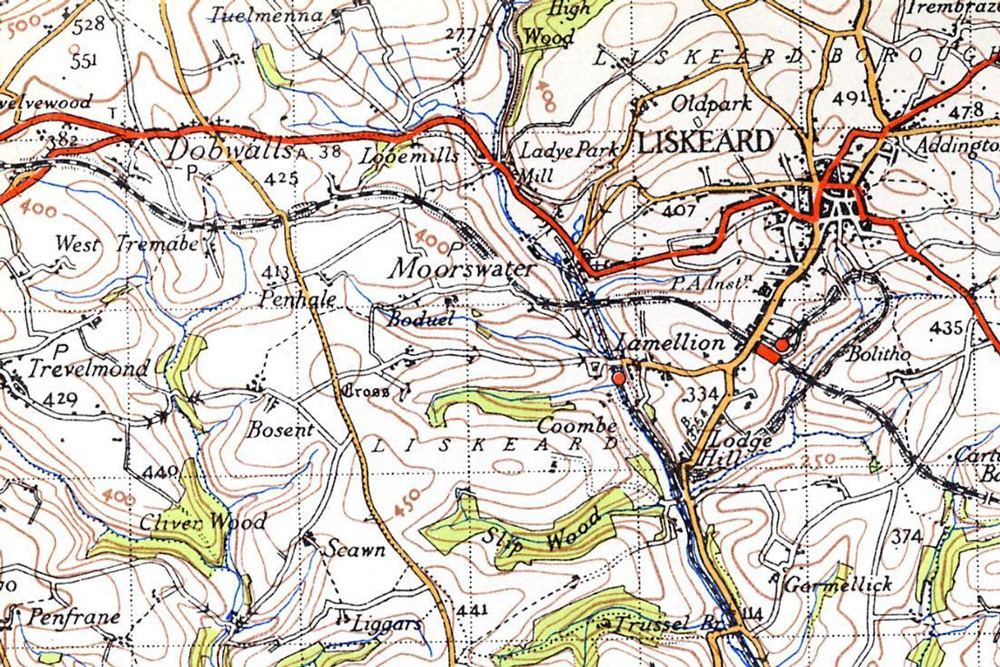
Actually, these maps are some of the best and most important in the history of the world. The processes of trigonometry, geometry and triangulation used in their creation were responsible for the advancement of cartography, navigation and discovery over the last 200 years. Not to mention the safety of British hikers.
10. Peters world map, 1973
In 1973, filmmaker Arno Peters presented a world map based on the work of 19th-century clergyman James Gall. Thus, the Gall-Peters map projection is my favourite map projection. (Yes, I have a favourite map projection – doesn’t everyone?)
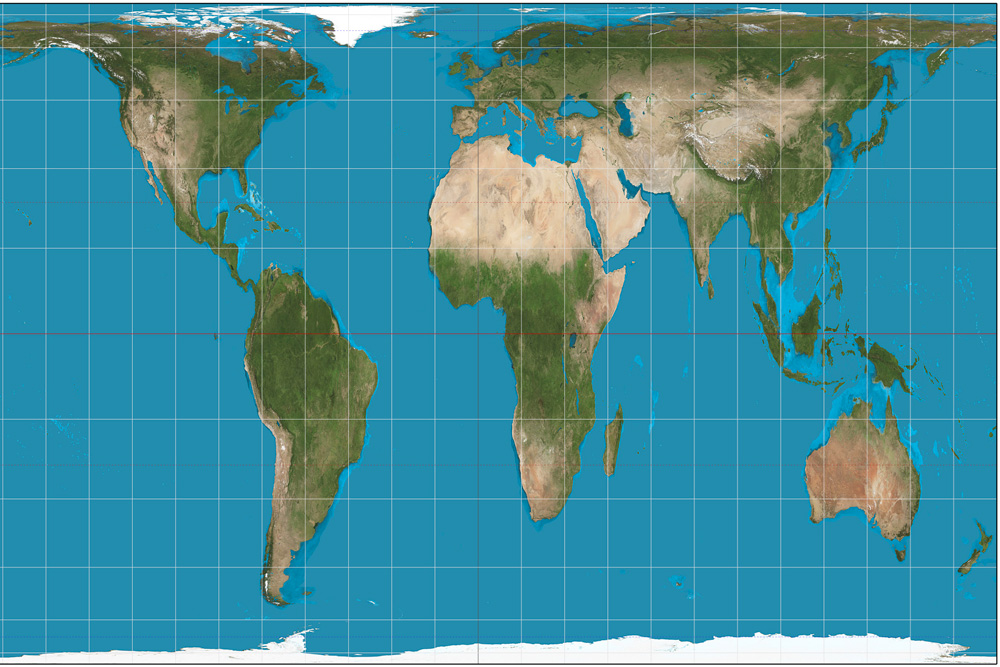
This projection uses a mathematical formula to project areas of equal size on the globe as equally sized on the map. For example, unlike the Mercator projection, Africa is represented at its true size: 14 times larger than Greenland (just compare it to the map below).
11. Google Maps, 2005 – present day
Google didn’t just change how we see the world with their online mapping service, they likely changed the world itself. Thanks to Google, we know exactly where our house is because that’s the first thing we all did when Street View was launched in 2007, wasn’t it?
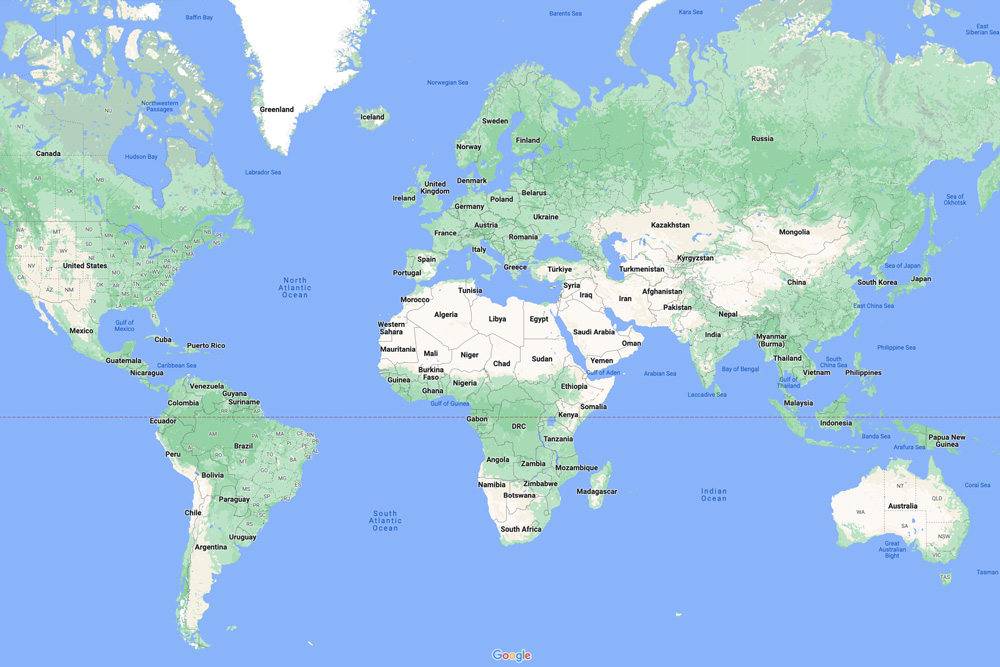
In fact, thanks to the various services and mobile apps, we know exactly where everything is, all the time. Kia won’t let us leave the house until we’ve looked up our destination on Google Maps. I’m less enthusiastic. They use the Mercator projection, you see. Bah.
12. Facebook connections map, 2010
It was Christmas Day when we were in Tahiti back in 2014 and I had exchanges with friends from all over the US, Europe, Australia and New Zealand on Facebook. Paul Butler, a Facebook intern, created this map based on where people live relative to their Facebook friends.
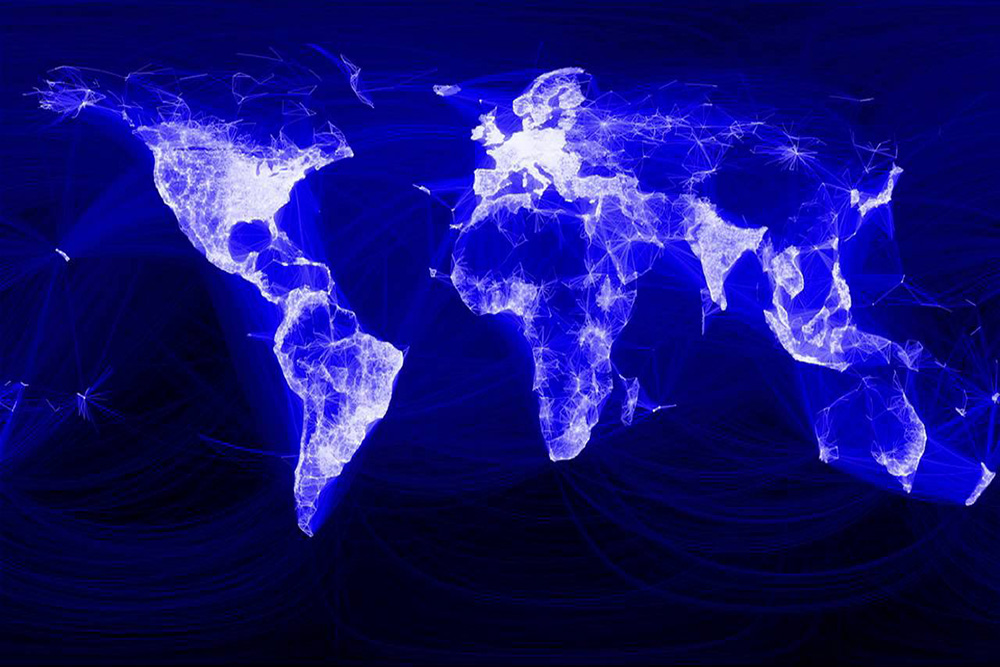
He said the following: “What really struck me, was knowing that the lines didn’t represent coasts or rivers or political borders, but real human relationships.”
In many ways, this is how the world is connected now.
Enjoyed this post? pin it for later…
If you enjoyed this article on the maps that changed our worldview, then we recommend Simon Garfield’s excellent On The Map: Why the world looks the way it does.


