Per person, the US and UK produce more plastic waste than any other major country, according to new research
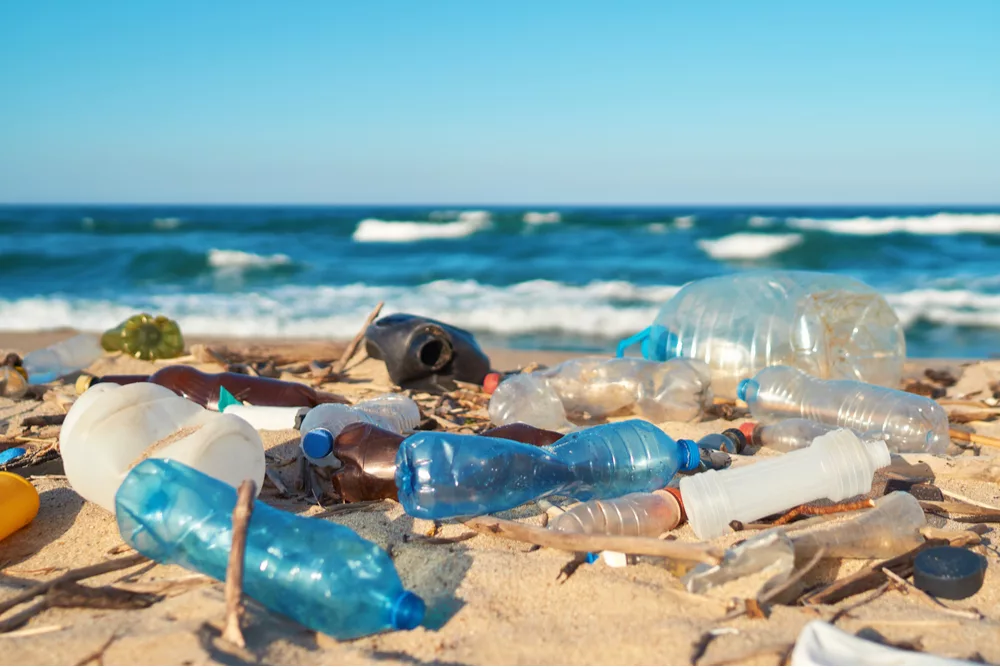
Plastic waste is polluting the entire planet. It has been found in the Mariana Trench (the deepest point in the ocean), falling from the sky in Arctic snow, embedded in Antarctic ice and secreted in the Alpine soils of Switzerland.
The UN Environment Programme has said that if current trends continue, our oceans could contain more plastic than fish by 2050.
It is widely recognised that plastic harms wildlife, but concern is also growing about the volume of microplastics humans consume in their food and water. One study found that the average person eats at least 50,000 particles of microplastic a year. Plastic fibres have even been found in 83% of tap water around the world.
Previous research has suggested that Asian countries, particularly those with coastal communities, are responsible for the highest quantities of plastic pollution with China, Indonesia and Vietnam among the worst culprits.
However, a recent report drawing on World Bank data and published in the journal Science Advances suggests that the US and UK produce the most plastic waste per person than any other major country.
“Around the world, one million plastic drinking bottles are purchased every minute, while 5 trillion single-use plastic bags are used worldwide every year. In total, half of all plastic produced is designed to be used only once — and then thrown away… If current trends continue, our oceans could contain more plastic than fish by 2050.”
UN Environment Programme
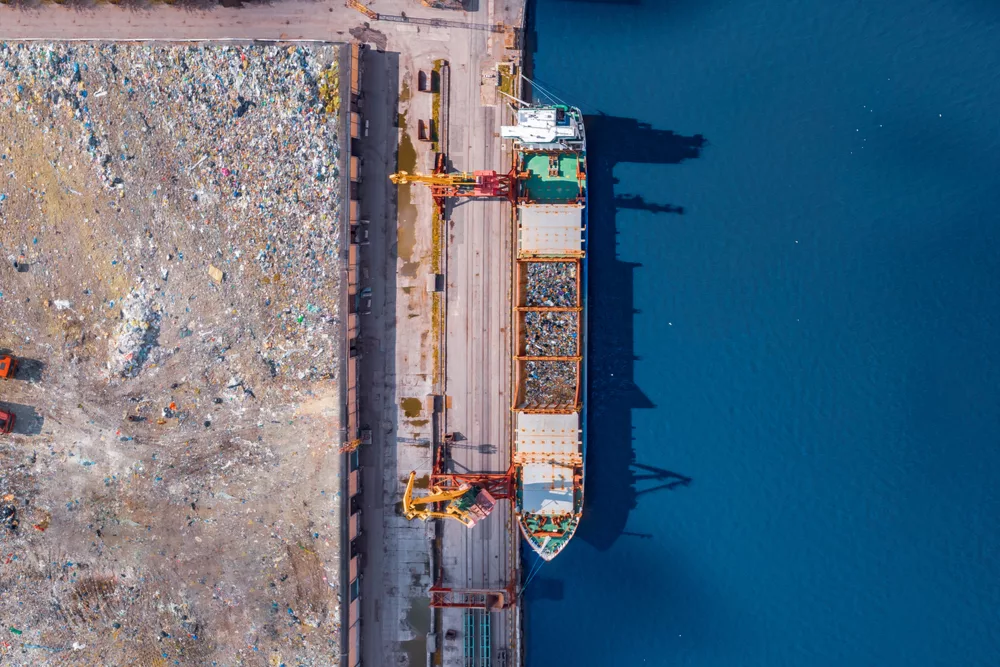
Unlike previous studies, the latest report assessed how much plastic waste is exported as well as how much littering and illegal dumping takes place. Drawing on data from 2016 – the latest available – the report shows that over half of plastic waste collected for recycling in the US was exported overseas. Researchers said that years of exporting had concealed the US’s immense contribution to plastic pollution.
A separate congressionally mandated report found that the US produces more plastic waste than all European Union member countries combined. Additionally, the overall amount of plastic waste generated in the US is believed to be two to eight times greater than in comparable countries.
“The US is 4% of the world’s population, yet it produces 17% of its plastic waste. The US needs to play a much bigger role in addressing the global plastic pollution crisis.”
Nick Mallos, Ocean Conservancy
Other high-income countries such as the UK, South Korea and several European Union nations also have large plastic waste footprints per capita.
Even though China and India may have the world’s largest populations, and China may be the world’s largest manufacturer of plastic, both countries rank behind the US in terms of generating plastic waste. And when it comes to plastic waste generation per capita, China and India are ranked 18th and 19th respectively.
It’s worth noting that even among the worst offenders there are large disparities. The UK’s close neighbour France produces just under 44kg of plastic waste per person – less than half of that generated by Britons – even though the two countries have similar-sized populations.
France has taken a proactive stand against single-use plastic, including the introduction of a penalty scheme that increased the cost of non-recyclable plastics and banning plastic packaging for nearly all fruit and vegetables from 2022. The disparity clearly demonstrates what can be achieved through more stringent government policy.
Countries with the highest total plastic waste production
The 20 countries with the highest total plastic waste production, measured in metric tons.
- USA, 34,020,748 metric tons
- India, 26,327,933
- China, 21,599,465
- Brazil, 10,675,989
- Indonesia, 9,128,000
- Russia, 8,467,156
- Germany, 6,683,412
- UK, 6,471,650
- Mexico, 5,902,490
- Japan, 4,881,161
- Thailand, 4,796,494
- South Korea, 4,514,186
- Italy, 3,365,130
- Egypt, 3,037,675
- France, 2,929,042
- Pakistan, 2,731,768
- Argentina, 2,656,771
- Algeria, 2,092,007
- Malaysia, 2,058,501
- Spain, 1,832,533
Plastic waste Per capita
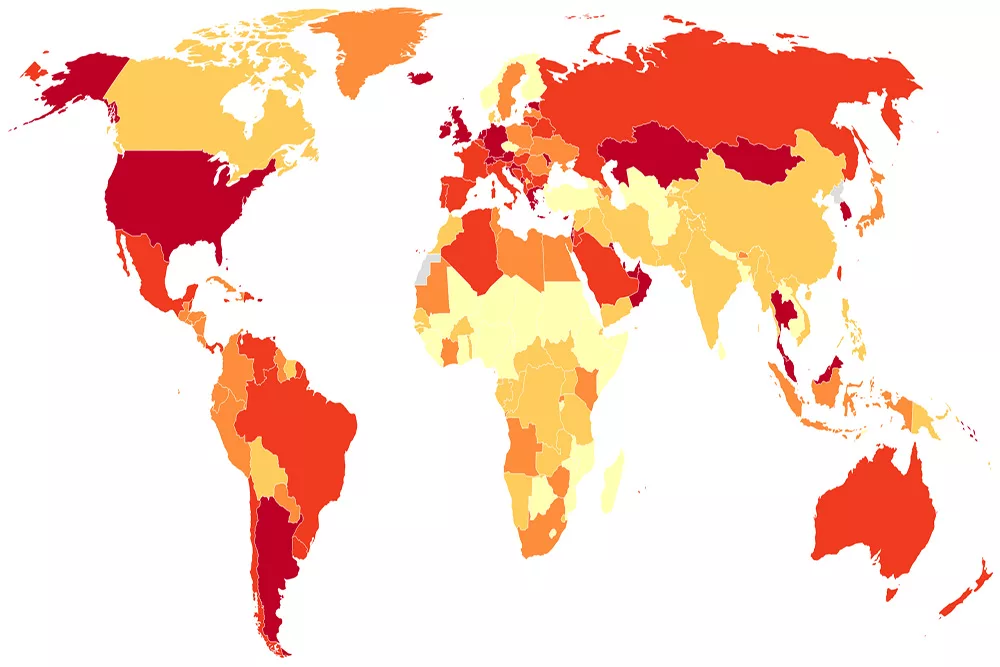
Among the 20 nations with the highest total plastic waste production, the US and UK produce the most plastic waste per person, per year. Roll over the map below to reveal a country’s per capita plastic waste generation in kilograms.
- USA, 105kg per person, per year
- UK, 99kg
- South Korea, 88kg
- Germany, 81kg
- Thailand, 70kg
- Malaysia, 67kg
- Argentina, 61kg
- Russia, 59kg
- Italy, 56kg
- Brazil, 52kg
- Algeria, 52kg
- Mexico, 48kg
- France, 44kg
- Spain, 39kg
- Japan, 38kg
- Indonesia, 35kg
- Egypt, 32kg
- India, 20kg
- China, 16kg
- Pakistan, 13kg
Complete ranking
Below is the complete ranking of the countries that produce the most plastic waste. The table can be sorted by total plastic waste production in metric tons (t) or waste production per person, per year, in kilograms (kg).
| Rank | Country | Population | Total | Per capital |
|---|---|---|---|---|
| 1 | Micronesia | 110,215 | 33,974 | 308 |
| 2 | Palau | 17,725 | 3,017 | 170 |
| 3 | Hong Kong SAR | 7,336,600 | 1,199,187 | 163 |
| 4 | St. Kitts & Nevis | 51,625 | 7,744 | 150 |
| 5 | Iceland | 335,439 | 48,572 | 145 |
| 6 | Singapore | 5,607,283 | 807,202 | 144 |
| 7 | Mongolia | 3,056,359 | 420,500 | 138 |
| 8 | Aruba | 104,872 | 13,899 | 133 |
| 9 | Moldova | 3,551,954 | 462,287 | 130 |
| 10 | Kuwait | 3,956,873 | 458,078 | 116 |
| 11 | Israel | 8,546,000 | 958,005 | 112 |
| 12 | Luxembourg | 582,014 | 64,974 | 112 |
| 13 | UAE | 9,360,980 | 1,028,556 | 110 |
| 14 | Switzerland | 8,373,338 | 911,616 | 109 |
| 15 | Barbados | 285,796 | 30,569 | 107 |
| 16 | USA | 323,071,342 | 34,020,748 | 105 |
| 17 | Trinidad & Tobago | 1,377,564 | 140,174 | 102 |
| 18 | Montenegro | 622,303 | 62,544 | 101 |
| 19 | UK | 65,595,565 | 6,471,650 | 99 |
| 20 | St. Lucia | 180,024 | 17,239 | 96 |
| 21 | Croatia | 4,174,349 | 385,686 | 92 |
| 22 | Bahamas | 377,931 | 34,313 | 91 |
| 23 | Oman | 4,479,219 | 405,081 | 90 |
| 24 | South Korea | 51,245,707 | 4,514,186 | 88 |
| 25 | Ireland | 4,755,335 | 391,496 | 82 |
| 26 | Brunei Dar. | 419,800 | 34,600 | 82 |
| 27 | Germany | 82,348,669 | 6,683,412 | 81 |
| 28 | Netherlands | 17,030,314 | 1,251,114 | 73 |
| 29 | Greece | 10,775,971 | 789,092 | 73 |
| 30 | Kazakhstan | 17,794,055 | 1,281,505 | 72 |
| 31 | Malta | 455,356 | 32,453 | 71 |
| 32 | Thailand | 68,971,331 | 4,796,494 | 70 |
| 33 | Cyprus | 1,170,187 | 81,473 | 70 |
| 34 | Solomon Is. | 619,437 | 42,950 | 69 |
| 35 | Nauru | 13,049 | 888 | 68 |
| 36 | Malaysia | 30,684,804 | 2,058,501 | 67 |
| 37 | Estonia | 1,315,790 | 88,500 | 67 |
| 38 | Andorra | 77,297 | 4,926 | 64 |
| 39 | Qatar | 2,654,374 | 167,332 | 63 |
| 40 | Austria | 8,736,668 | 542,461 | 62 |
| 41 | Argentina | 43,590,368 | 2,656,771 | 61 |
| 42 | Russia | 144,342,396 | 8,467,156 | 59 |
| 43 | Taiwan | 23,557,000 | 1,392,828 | 59 |
| 44 | Belgium | 11,331,422 | 663,511 | 59 |
| 45 | Tuvalu | 11,225 | 658 | 59 |
| 46 | New Zealand | 4,693,200 | 270,550 | 58 |
| 47 | Italy | 60,627,498 | 3,365,130 | 56 |
| 48 | Saudi Arabia | 32,442,572 | 1,810,101 | 56 |
| 49 | Slovenia | 2,065,042 | 115,628 | 56 |
| 50 | Seychelles | 94,677 | 5,338 | 56 |
| 51 | Belarus | 9,501,534 | 507,334 | 53 |
| 52 | West Bank & Gaza | 4,367,088 | 231,307 | 53 |
| 53 | North Macedonia | 2,080,745 | 110,725 | 53 |
| 54 | Belize | 368,400 | 19,464 | 53 |
| 55 | Brazil | 206,163,058 | 10,675,989 | 52 |
| 56 | Algeria | 40,551,404 | 2,092,007 | 52 |
| 57 | Bulgaria | 7,127,822 | 370,493 | 52 |
| 58 | Kiribati | 112,524 | 5,894 | 52 |
| 59 | Liechtenstein | 37,658 | 1,916 | 51 |
| 60 | Portugal | 10,325,452 | 512,057 | 50 |
| 61 | Hungary | 9,814,023 | 483,046 | 49 |
| 62 | Bahrain | 1,425,791 | 70,444 | 49 |
| 63 | Macao SAR | 612,836 | 29,857 | 49 |
| 64 | Mexico | 123,333,376 | 5,902,490 | 48 |
| 65 | Grenada | 110,261 | 5,307 | 48 |
| 66 | Jordan | 9,551,467 | 446,941 | 47 |
| 67 | Lithuania | 2,868,231 | 134,043 | 47 |
| 68 | Antigua & Bar. | 94,527 | 4,321 | 46 |
| 69 | Panama | 4,037,078 | 181,993 | 45 |
| 70 | France | 66,859,768 | 2,929,042 | 44 |
| 71 | Jamaica | 2,906,238 | 128,307 | 44 |
| 72 | Australia | 24,190,907 | 1,035,084 | 43 |
| 73 | Mauritius | 1,263,473 | 54,254 | 43 |
| 74 | Serbia | 7,058,322 | 295,230 | 42 |
| 75 | Bosnia & Herz. | 3,386,267 | 141,879 | 42 |
| 76 | Uruguay | 3,424,132 | 139,881 | 41 |
| 77 | Dominican Rep. | 10,397,743 | 420,276 | 40 |
| 78 | Spain | 46,483,569 | 1,832,533 | 39 |
| 79 | Venezuela | 29,846,179 | 1,160,801 | 39 |
| 80 | Chile | 18,209,068 | 707,903 | 39 |
| 81 | Albania | 2,876,101 | 113,099 | 39 |
| 82 | Japan | 126,994,511 | 4,881,161 | 38 |
| 83 | Ecuador | 16,491,115 | 607,148 | 37 |
| 84 | Lebanon | 6,711,121 | 247,112 | 37 |
| 85 | Slovak Rep. | 5,430,798 | 199,500 | 37 |
| 86 | Guyana | 771,366 | 28,750 | 37 |
| 87 | Colombia | 48,171,392 | 1,728,873 | 36 |
| 88 | Indonesia | 261,554,226 | 9,128,000 | 35 |
| 89 | Poland | 37,970,087 | 1,341,572 | 35 |
| 90 | Honduras | 9,270,795 | 311,548 | 34 |
| 91 | Costa Rica | 4,899,345 | 167,858 | 34 |
| 92 | Latvia | 1,959,537 | 66,600 | 34 |
| 93 | Nicaragua | 6,303,974 | 205,548 | 33 |
| 94 | Egypt | 94,447,072 | 3,037,675 | 32 |
| 95 | Paraguay | 6,777,872 | 214,189 | 32 |
| 96 | Romania | 19,702,332 | 615,756 | 31 |
| 97 | Peru | 30,926,032 | 919,222 | 30 |
| 98 | Dominica | 71,307 | 2,167 | 30 |
| 99 | Guatemala | 16,583,060 | 488,396 | 29 |
| 100 | Zimbabwe | 14,030,390 | 413,802 | 29 |
| 101 | Sweden | 9,923,085 | 291,292 | 29 |
| 102 | San Marino | 33,504 | 962 | 29 |
| 103 | Rwanda | 11,668,818 | 328,873 | 28 |
| 104 | Libya | 6,492,164 | 181,482 | 28 |
| 105 | El Salvador | 6,356,143 | 178,687 | 28 |
| 106 | Mauritania | 4,163,534 | 114,598 | 28 |
| 107 | Tunisia | 11,303,946 | 303,846 | 27 |
| 108 | Haiti | 10,839,970 | 293,351 | 27 |
| 109 | Bhutan | 736,709 | 19,844 | 27 |
| 110 | Kenya | 49,051,686 | 1,279,843 | 26 |
| 111 | Cabo Verde | 531,146 | 13,707 | 26 |
| 112 | South Africa | 56,203,654 | 1,425,323 | 25 |
| 113 | Cuba | 11,335,109 | 270,533 | 24 |
| 114 | St. Vincent & Gren. | 109,459 | 2,668 | 24 |
| 115 | Tonga | 101,133 | 2,392 | 24 |
| 116 | Ukraine | 45,004,645 | 1,053,523 | 23 |
| 117 | Angola | 28,842,484 | 651,928 | 23 |
| 118 | Cote d'Ivoire | 23,822,714 | 541,453 | 23 |
| 119 | Azerbaijan | 9,757,812 | 228,304 | 23 |
| 120 | Canada | 36,109,487 | 769,984 | 21 |
| 121 | Bolivia | 11,031,813 | 232,092 | 21 |
| 122 | Kyrgyzstan | 6,079,500 | 126,059 | 21 |
| 123 | Namibia | 2,358,041 | 49,176 | 21 |
| 124 | India | 1,324,509,589 | 26,327,933 | 20 |
| 125 | Iraq | 36,610,632 | 738,899 | 20 |
| 126 | South Sudan | 10,832,512 | 214,119 | 20 |
| 127 | Tajikistan | 8,663,579 | 176,179 | 20 |
| 128 | Gabon | 2,007,873 | 39,585 | 20 |
| 129 | Kosovo | 1,816,200 | 35,561 | 20 |
| 130 | Marshall Is. | 57,735 | 1,127 | 20 |
| 131 | Iran | 79,564,016 | 1,500,585 | 19 |
| 132 | Zambia | 16,363,507 | 305,198 | 19 |
| 133 | Armenia | 2,936,146 | 57,174 | 19 |
| 134 | Eswatini | 1,113,984 | 21,384 | 19 |
| 135 | Djibouti | 929,112 | 17,521 | 19 |
| 136 | Samoa | 194,535 | 3,765 | 19 |
| 137 | Yemen | 27,168,210 | 483,682 | 18 |
| 138 | Congo | 4,980,999 | 87,635 | 18 |
| 139 | Central African Rep. | 4,537,687 | 83,041 | 18 |
| 140 | Fiji | 872,399 | 15,471 | 18 |
| 141 | China | 1,378,665,000 | 21,599,465 | 16 |
| 142 | Myanmar | 53,045,226 | 856,961 | 16 |
| 143 | Uganda | 39,647,506 | 636,506 | 16 |
| 144 | Morocco | 35,126,296 | 570,102 | 16 |
| 145 | Togo | 7,509,952 | 116,946 | 16 |
| 146 | Eq. Guinea | 1,215,179 | 19,447 | 16 |
| 147 | Suriname | 564,888 | 9,087 | 16 |
| 148 | Vanuatu | 278,330 | 4,530 | 16 |
| 149 | Philippines | 103,663,927 | 1,543,668 | 15 |
| 150 | Vietnam | 93,638,724 | 1,404,873 | 15 |
| 151 | Tanzania | 53,050,790 | 814,511 | 15 |
| 152 | Syrian | 17,453,933 | 269,480 | 15 |
| 153 | Senegal | 14,993,528 | 220,865 | 15 |
| 154 | DR Congo | 78,789,127 | 1,078,892 | 14 |
| 155 | Maldives | 475,513 | 6,740 | 14 |
| 156 | Pakistan | 203,627,284 | 2,731,768 | 13 |
| 157 | Burkina Faso | 18,646,378 | 239,327 | 13 |
| 158 | Papua New Guinea | 8,271,760 | 105,241 | 13 |
| 159 | Denmark | 5,728,010 | 72,896 | 13 |
| 160 | Guinea-Bissau | 1,782,437 | 22,323 | 13 |
| 161 | Sao Tome & Prin. | 203,227 | 2,646 | 13 |
| 162 | Monaco | 38,070 | 507 | 13 |
| 163 | Turkey | 79,821,724 | 959,515 | 12 |
| 164 | Somalia | 14,185,613 | 174,457 | 12 |
| 165 | Eritrea | 4,955,000 | 58,069 | 12 |
| 166 | Liberia | 4,586,788 | 54,221 | 12 |
| 167 | Afghanistan | 35,383,128 | 405,254 | 11 |
| 168 | Madagascar | 24,894,380 | 282,657 | 11 |
| 169 | Botswana | 2,159,944 | 24,741 | 11 |
| 170 | Gambia | 2,149,139 | 22,631 | 11 |
| 171 | Nepal | 27,261,131 | 267,823 | 10 |
| 172 | Burundi | 10,487,998 | 103,253 | 10 |
| 173 | Norway | 5,234,519 | 49,878 | 10 |
| 174 | Nigeria | 185,960,289 | 1,659,502 | 9 |
| 175 | Sudan | 39,847,440 | 371,123 | 9 |
| 176 | Sri Lanka | 21,203,000 | 180,701 | 9 |
| 177 | Benin | 10,872,067 | 102,301 | 9 |
| 178 | Timor-Leste | 1,219,288 | 10,539 | 9 |
| 179 | Sierra Leone | 7,328,838 | 62,190 | 8 |
| 180 | Ghana | 28,481,946 | 211,518 | 7 |
| 181 | Mozambique | 27,829,942 | 198,365 | 7 |
| 182 | Chad | 14,561,666 | 98,746 | 7 |
| 183 | Czech Rep. | 10,566,332 | 74,573 | 7 |
| 184 | Finland | 5,495,303 | 40,159 | 7 |
| 185 | Georgia | 3,727,505 | 25,637 | 7 |
| 186 | Malawi | 17,205,289 | 106,140 | 6 |
| 187 | Cambodia | 15,766,293 | 99,748 | 6 |
| 188 | Comoros | 795,592 | 4,657 | 6 |
| 189 | Bangladesh | 157,970,840 | 764,951 | 5 |
| 190 | Cameroon | 23,926,539 | 119,518 | 5 |
| 191 | Uzbekistan | 31,847,900 | 115,565 | 4 |
| 192 | Niger | 20,788,838 | 85,628 | 4 |
| 193 | Lesotho | 2,075,001 | 8,622 | 4 |
| 194 | Guinea | 11,738,441 | 37,647 | 3 |
| 195 | Laos | 6,845,846 | 22,232 | 3 |
| 196 | Mali | 17,965,429 | 44,152 | 2 |
| 197 | Turkmenistan | 5,662,372 | 12,400 | 2 |
| 198 | Ethiopia | 103,603,501 | 154,743 | 1 |
Enjoyed this post? pin it for later…